Before and After #12: Visualization
|
|
| |||
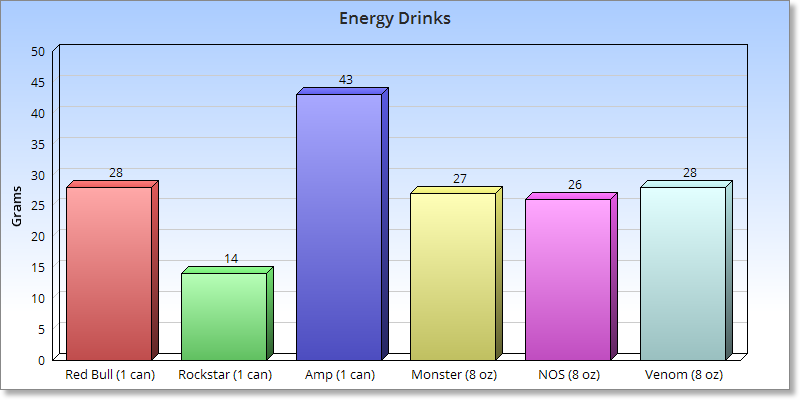
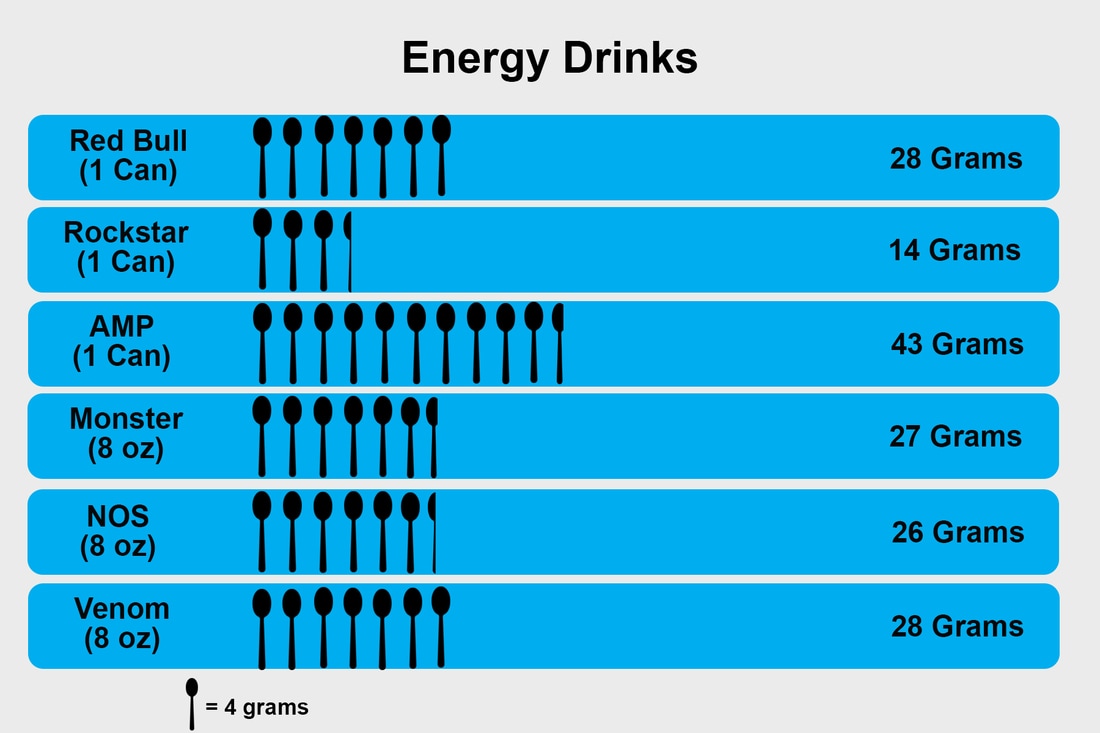
For this assignment part of the goal was to make numbers and graph visually appealing. I decided to go out side of the options offered to us and found a graph showing the grams of sugar in energy drinks. The original image is boring and plain and not "visually appealing". Therefore I decided to create a pictograph to represent the same information. I decided to think about how I could show grams of sugar and therefore decided to use a spoon to represent this term of measurement. I decided that each spoon would be 4 grams as shown in the key at the bottom of the image. The new image is more exciting and is a better way to show the grams of sugar.
